


Veteran-Owned Small Business (VOSB)
Using Thermal Mapping as an Asset Management Tool for Your Campus or Large Roofs
Understanding Aerial Infrared Imagery
Thermal infrared (IR) imagery is imagery that shows heat. It is often in the form of a grayscale picture whose shades of gray indicate the differences in temperature and emissivity of objects in the image. Typically, objects in the image that look lighter are warmer and those that look darker are cooler. Bright white objects are the warmest in the images. Black objects are the coolest. Any object with a temperature above absolute zero ( 0 Kelvin or –273 degrees Celsius) emits infrared radiation. An infrared picture only shows objects which emit infrared wavelengths in the 3000-5000 nanometer range. Objects in visible light wavelengths of 400 to 700 nanometers are detected, but only because they also emit heat. An example of this would be a warm street light that can be seen in the IR imagery. We record infrared imagery on digital videotape and may later copy it to a VHS videotape and/or a JPEG digital image file. The image may be modified in a number of ways to enhance its value to the end user, such as creating a false-color image or adjusting the brightness and contrast of a grayscale image. The digital images are captured directly to JPEG format and placed on a CD-ROM.
Advantages of Aerial IR imaging using fixed-wing aircraft
- Reports are created with high-angle, straight down (NADIR) infrared images, which reduce reflections and capture large areas at once, making the imagery easier to analyze and the report less expensive to produce.
- Since images are captured straight-down or ‘plan view’, the report is clear, concise and easy to understand because infrared images, visual images and AutoCAD® drawings are reconciled.
- We have performed numerous qualitative infrared thermographic surveys of steam systems for universities, cities and industrial clients nationwide. We brought together all the components that truly make us the state-of-the-art in the field of infrared thermography and our deliverable product is the best on the market today. We use high-resolution infrared imagers, digital recording equipment, techniques that have been refined over the years and the attitude that we are going to obtain the best imagery possible and produce a professional report in a timely manner.
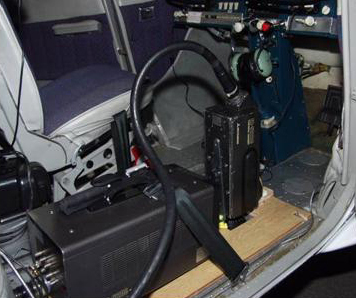
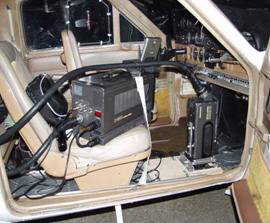
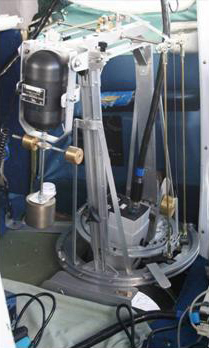

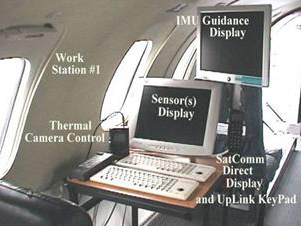
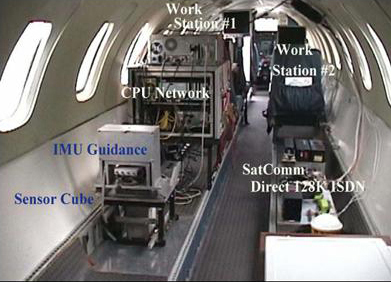
Typical installations of infrared imaging and digital data systems. Click for larger images.
TopSample Thermal Map
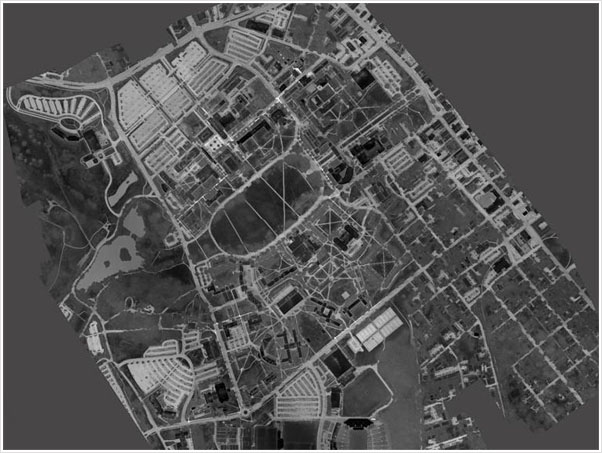
This is a mosaic infrared (IR) image a ~ 1000-acre campus. Click for full mosaic.
TopUnderstanding Aerial Infrared Steam System, Hot Water and Chilled Water Line Imagery
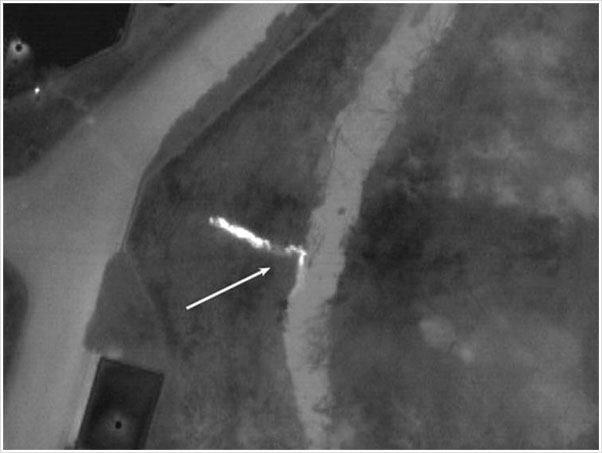
Underground steam lines are almost always readily visible with infrared imaging, even when no notable problems exist. This is due to the fact that no matter how good the insulation, there is always heat loss from the lines which makes its way to the surface. Problem areas are generally quite evident, having brighter white IR signatures that exceed the norm. Steam line faults normally appear as an overheated line or as a large hotspot in the form of a bulge or balloon along the line. Overheated lines often occur when the steam line is located in a conduit or tunnel. If there is a leak in the line it will heat up the whole conduit with escaping steam. If a steam line is buried directly in the ground with an insulating jacket, a leak will usually saturate the insulation, rendering it largely ineffective and will begin to transfer heat into the ground around the leak, producing the classic bulge or balloon-like hot area straddling the line. Finally, some leaks may show up as an overheated manhole or vault cover. Manholes or vaults that contain steam system control apparatus which are leaking will often heat the covers to warmer than normal temperatures.
Steam line imagery can be a little misleading, unless one understands and interprets the relative brightness and temperature of a given line correctly. A steam line that is the same temperature from one end to the other that passes under different surfaces and materials can exhibit a variety of temperature variations. For example, five different apparent temperatures will result from the same temperature line that runs under a grass-covered field, an asphalt parking lot, a concrete loading dock, a gravel-covered area and bare earth pathway.
High temperature hot water (HTHW), medium temperature hot water (MTHW) and low temperature hot water (LTHW) lines benefit similarly to steam distribution and condensate return systems, with an associated degree of difficulty in surveying because of the declining temperature difference to that of surface. Chilled water supply (CHWS) and chilled water return (CHWR) lines are usually cooler than the surface temperature and can be surveyed for thermal loss and leaks as well.
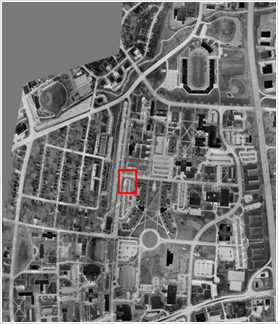
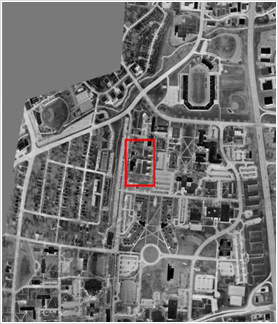
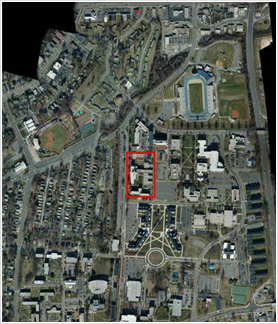
Example of mosaic thermal and visible image (red area box shown on next images). Click for full mosaic.
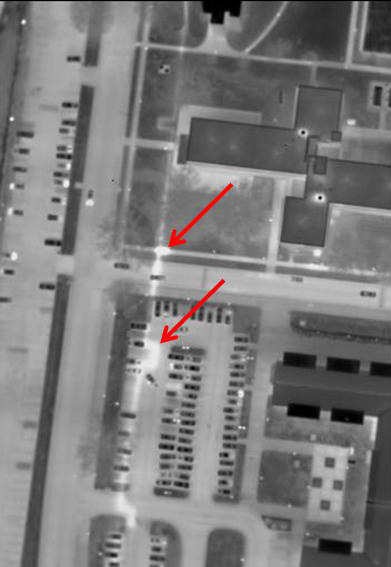
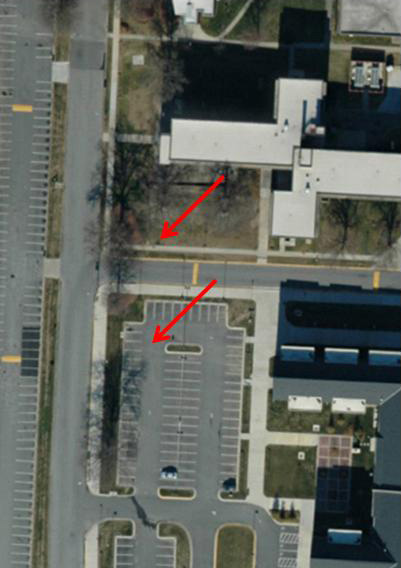
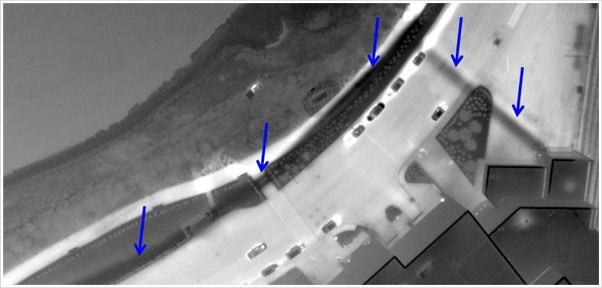
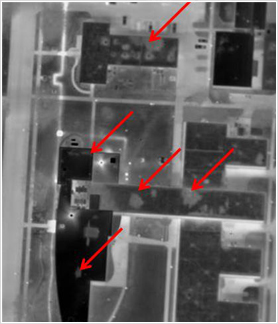
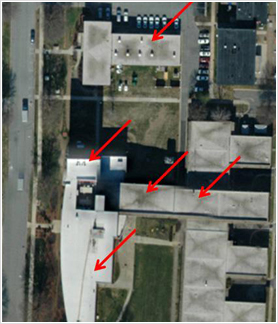
Example of mosaic thermal and visible image (steam line leaks). Click for larger images.
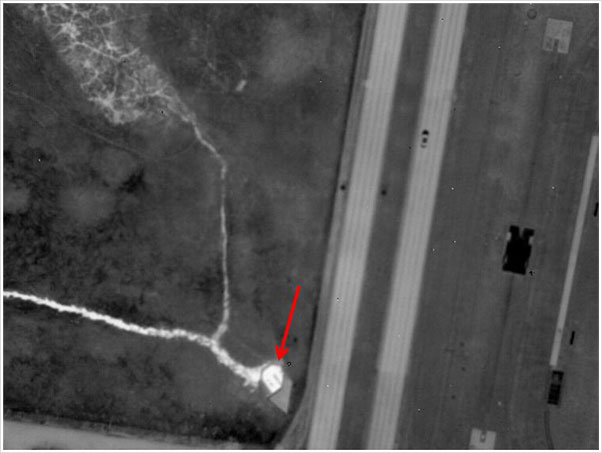
Steam and condensate return lines heat the ground above the line (insulation failures).
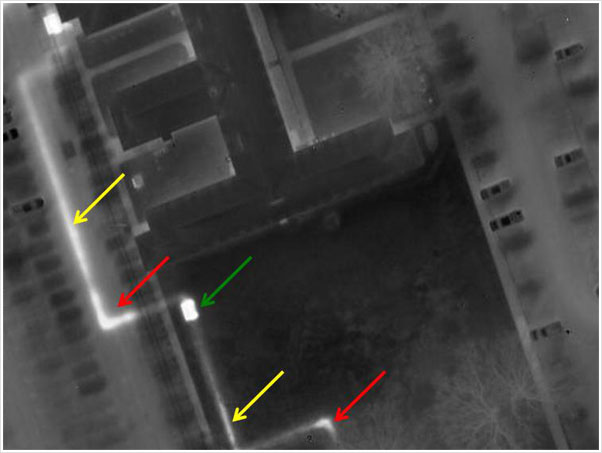
Steam and condensate return lines heat the ground above the line (steam line leak).
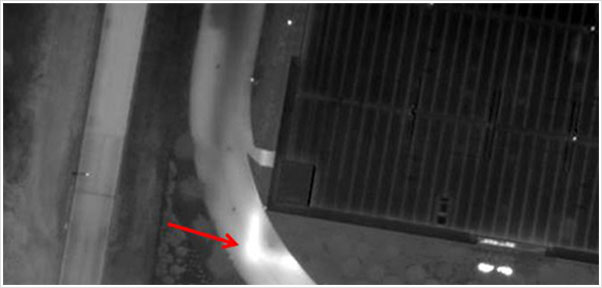
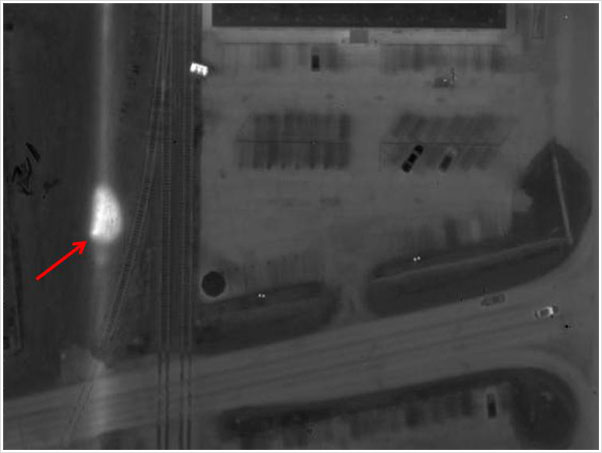
Steam line leak and heated water leaking upward, to the ground surface.
Buried chilled water line cools the surface above the line.
Top
Understanding Aerial Infrared Imagery of Waterways Systems
Leaking sewage collector lines, storm water drain discharges and illegal taps into storm water drainage lines can often be identified by their thermal infrared signatures during certain times of the year. As these sources of pollution leak, seep or empty into creeks, streams, rivers and lakes, their thermal signatures vary from their surroundings and they can be pinpointed accurately from the air. Cool temperatures (lower than 40 degrees F) and dry (no rain in the last 48 hours) conditions are required. As a general rule, the lower the ground surface and the water surface temperatures, the more contrasting the image.
A given area of any waterway will exhibit near homogenous temperature patterns except for areas where another liquid has joined the flow. This flow of liquid typically appears warm as compared to the surface water in a creek, stream, river or lake - particularly during cooler times of the year, due to the relative warmth of the ground a short distance below the surface. Leaks from nearby lines often come to the surface through lateral transfer to a creek, stream, river or lake bed, or to a slope leading down to the surface of the water. These leak areas and the warm plume of liquid joining and flowing downstream with the body of water are visible in the thermal infrared spectrum due to the difference in temperatures of the two liquids. Late fall, winter and early spring are well suited to this type of inspection because of the cooler water temperatures (ground and surface waters) and because the interference to view by foliage is minimized. Ground water seeps and outfalls of all types are also easily distinguishable for similar reasons.
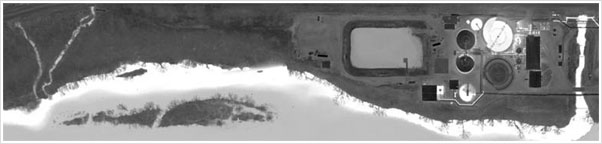
IR of a waterway.
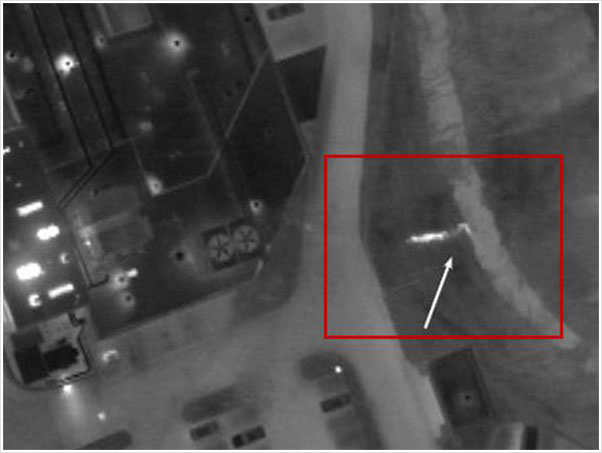
IR image of a storm drain outfall (expanded view shown on next image).
IR image of a storm drain outfall.
IR image of a storm drain outfall.
TopUnderstanding Aerial Infrared Roof Imagery
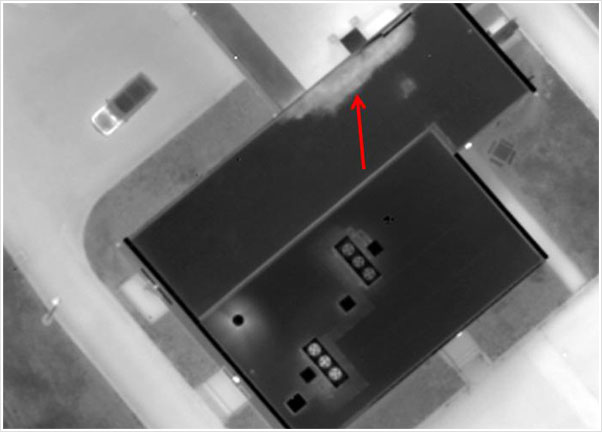
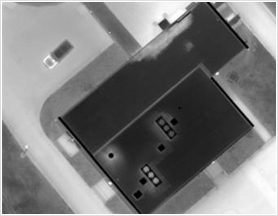
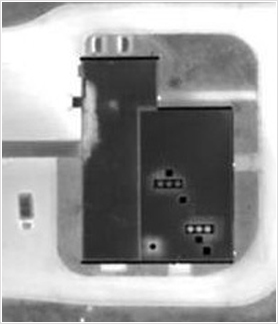
Areas of roof moisture contamination often manifest themselves as warmer (lighter colored) areas that may be nebulous in shape and sometimes mottled in appearance, although they are commonly found in linear or puddle-like shapes. The linear shapes many times follow low areas, drainage routes, roof edges and seams. Puddle-like round or oblong shapes often form around roof penetrations such as mechanical equipment, standpipes, vents and drains. The wet areas are lighter in color because the latent heat (from daylight sunshine) in the trapped water mass is greater than in the dry, functioning insulation or roof substrate. After sunset when the roof structure cools down, wet areas of roof insulation and other materials continue to radiate heat, allowing our sensitive infrared cameras to detect the sources of heat and record them for later analysis.
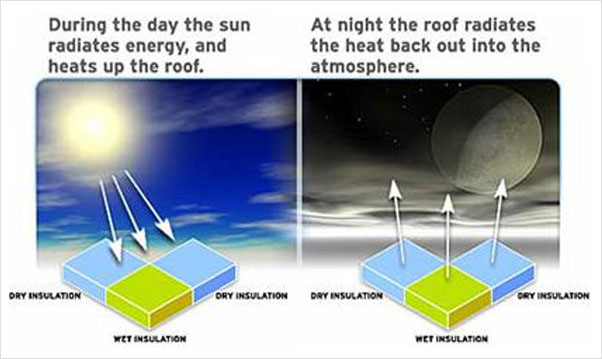
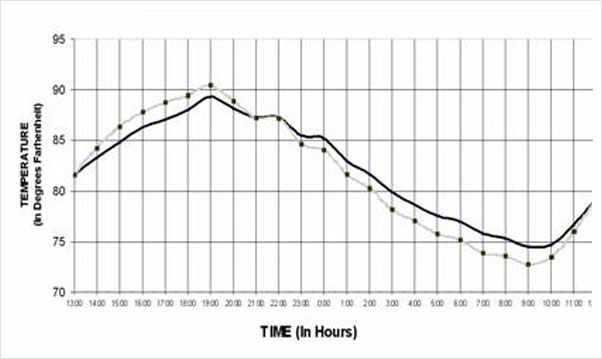
Performing infrared roof moisture surveys while standing on the roof is not the best method because imagery from a walk-on survey is not as useful as aerial imagery. The same laws of physics apply to both aerial IR and on-roof IR. A dry roof, low winds and no rain are needed on the night of the survey. However, the "window" when the roof is radiating heat differently from wet and dry areas is longer with aerial infrared because slight nuances of temperatures over large areas are recognizable. A high angle of view and high resolution are needed to produce usable imagery.
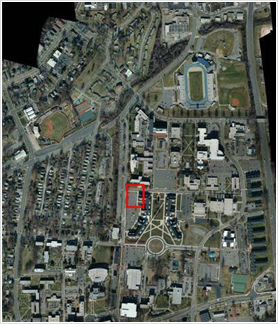
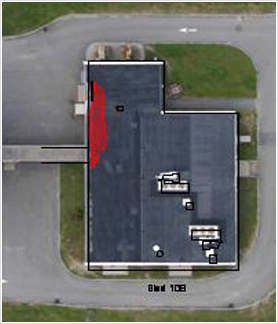
Example of mosaic thermal and visible image (red area box shown on next images). Click for full mosaic.
Example of entrained roof moisture in roofs.
Example of 4” GRE thermal image of a roof.
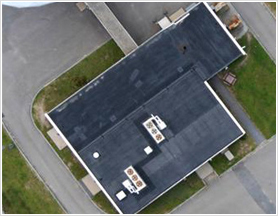
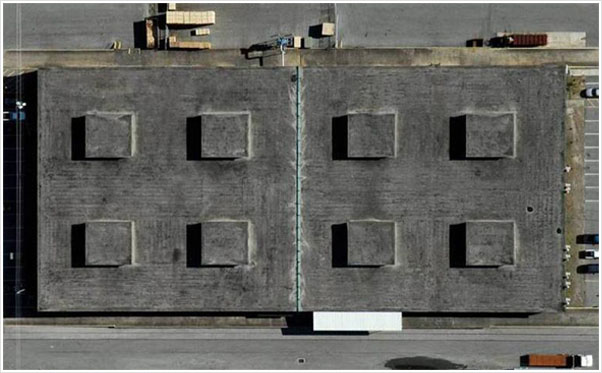
Example of visible image.
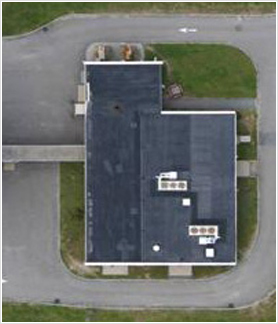
Visual Image
CAD Drawing
Example of thermal image.
IR Image
CAD Overlay
Photograph
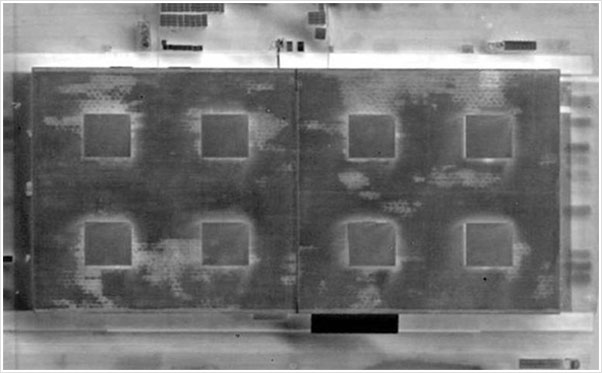
Thermograph
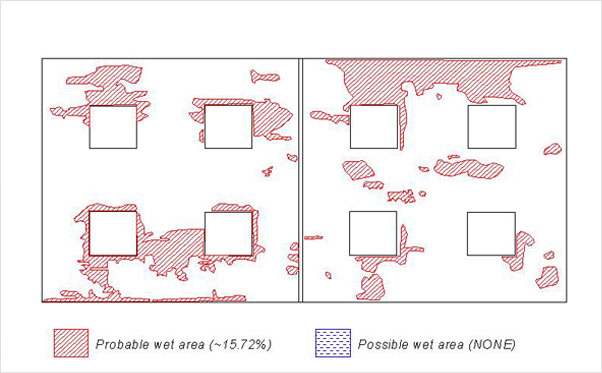
CAD Drawing
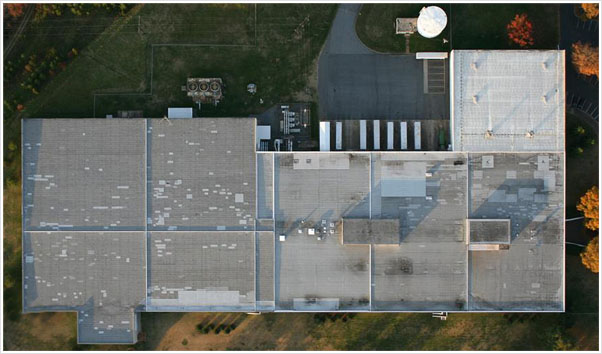
Example of mosaic visible image of a low-sloped roof. Click for full mosaic.
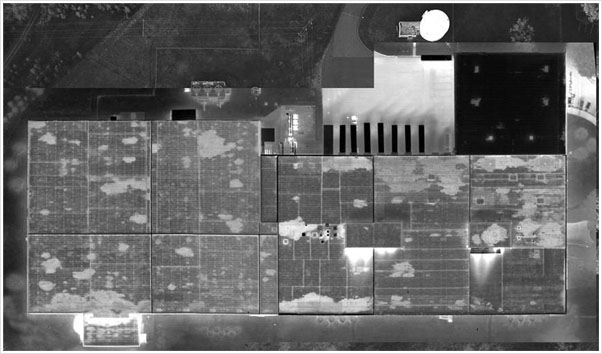
Example of mosaic thermal image of a low-sloped roof. Click for full mosaic.
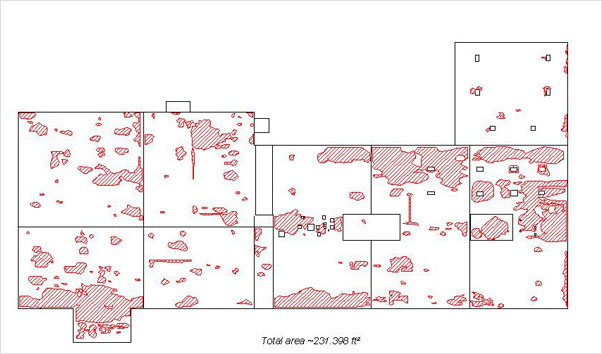
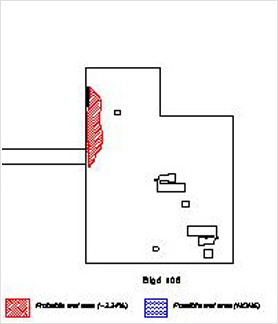
Example of CAD drawing of a low-sloped roof.
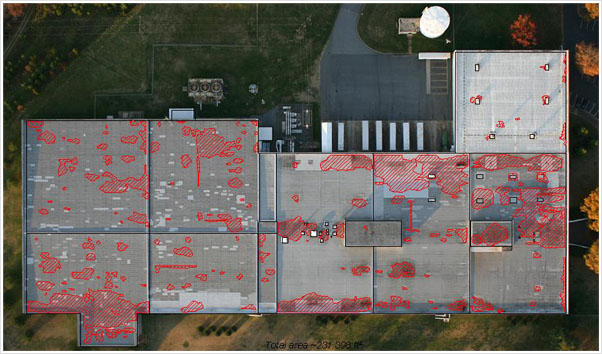
Example of mosaic visible image of a low-sloped roof with CAD drawing overlay.
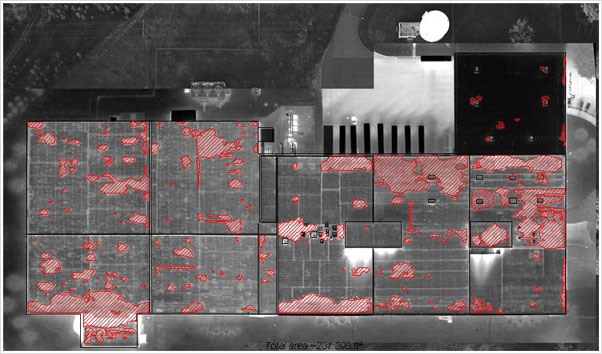
Example of mosaic thermal image of a low-sloped roof with CAD drawing overlay.
Top